In SCOM 2012 you get also new possibilities to monitor your JEE application servers. If you are already monitoring an application server e.g. Tomcat then you will find under the authoring pane new Management Pack Templates.
If you deployed BeanSpy and you are doing some deep monitoring with your JEE application servers, the next step could be to add some salt, sorry I mean beans into our monitoring soup ![]() .
.
Now we want to play using MBeans. But what are MBeans? Here the a short description from Microsoft:
Java applications running in a JEE application server also have a mechanism for providing application-specific management information. This mechanism is called “MBeans”, and is a JEE standard. The application writer must choose to create custom MBeans and populate them with relevant statistics as the application runs, somewhat similar to performance counters in a Windows application.
So far so good. Let’s start an example….
I installed onto my Tomcat application server a sample application called surprisingly “Hello World” from this site here.
After installation I have another application directory…
In SCOM it looks like this…
It is an application page which says “Hello World” using different technologies.
We will create a 3-state monitor which should give us a green check mark if nobody looks at our page (= 0 active sessions), the monitor turns into a warning if there is 1 active session and critical if there are 2 active sessions.
Start “JEE Application Availability Monitor (3-state)” Monitoring Wizard
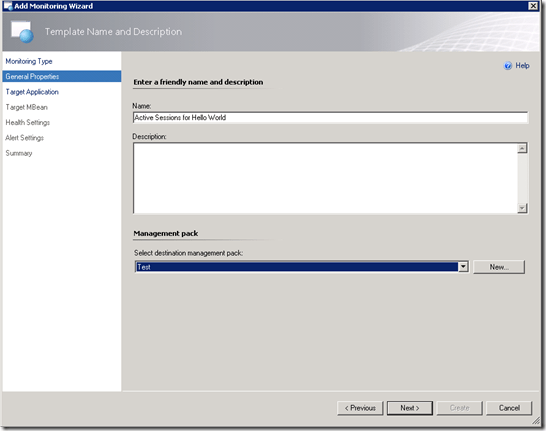
Next, I call it “Active Sessions for Hello World”
Now I choose my application, in this case “mytomcat-helloworld”
Select the application server and click “Browse”…
A new windows appears if you click “Run” all possible MBeans list up…phuhhh. O.k. at least we can filter using our application name mytomcat-helloworld. Click “Apply” and the list will just contain MBeans which we need.
At this point I would like to say thank you to Microsoft for making this window not bigger. Wouldn’t it be great if we could resize this window?
Anyway, click through and at some point you will find your property you need.
My property I found was here…it is called “activeSessions”…COOL! As you can see there are other like “maxActiveSessions” etc.
Click “Select” and hit “Next”
In this screen you do the actual mapping between your properties before and the values you wan’t to generate an alert. Click on the “Browse” button to select the property.
Repeat this for the “Healthy expression”, “Warning Expression” and “Critical Expression”. I set the expression value to “0” for healthy, “1” for warning and “2” for critical. This means if there are no active sessions everything is green. If there is one or two sessions it will alert me either a warning or a critical alert.
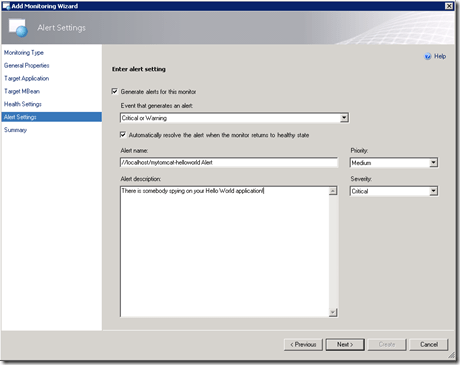
The last step we will configure the alert settings. Make your adjustments as needed. If you want that you will receive either a warning or critical alerts change the severity to “Match monitor’s health”.
And “Create” the monitor….
And here the template….
Testing
I will use my client to connect to the application…
There should be now one active session. Tomcat shows this on its application panel…
Tataaaa….the application turns into a warning
and the health explorer shows why ![]() . The “activeSessions” property contains the value “1”.
. The “activeSessions” property contains the value “1”.
and here the alert…
If I connected with 2 sessions the monitor turned red…
But what happened if I connect with 3 sessions ![]() ? Yes, exactly it will turn healthy…
? Yes, exactly it will turn healthy…
I hope you like this post!
cu next time….


FYI at least in SCOM 2012 SP1, on Server 2012, that MBean monitor window is now sizable
Hi AJ
Thank you very much for your valuable comment!
Regards,
Stefan
Does BeanSpy works with SCOM 2007? With BeanSpy can we monitor custom MBeans written specifically for my application to monitor some of my application specific components?